Explore different industries in the Canadian economy and see how they are interconnected and evolving.
Overview
Part of the “You Are the Economy” series of lessons, this lesson plan provides an introduction to the Canadian economy. For best results, follow the activities in order.
Big idea
Canada's diverse goods and services industries have evolved over time due to demand and specialization.
Total time
110 minutes (plus optional homework time)
Grade levels
Grades 7–12; Secondary I–V
Subject areas
Social studies
- economic significance of different sectors of the economy (tourism, forestry, energy production and industry)
- Canada’s resources and industries
- regional and international economic development
Economics
- the make-up of the Canadian economy
- economic globalization
- analyzing information using economic thinking
- government intervention in market systems
- social, cultural and economic consequences of growth and development
Learning objectives
Students will:
- connect Canadian sectors to economic concepts such as economies of scale, foreign exchange rates, advantage and specialization
- analyze regional economies within Canada and find connections among them
- predict future challenges and opportunities for Canadian industries
- compare sectors to employment data within their region
Materials
Classroom supplies and technology
- pens and pencils
- whiteboard or chart paper and markers
- scissors to cut out the hexagon tiles (either prepare in advance or have students cut out)
- smartboard or projector and screen
- internet-connected devices (phones, tablets or computers)
Handouts and worksheets
- Download the lesson plan
- Print these resources:
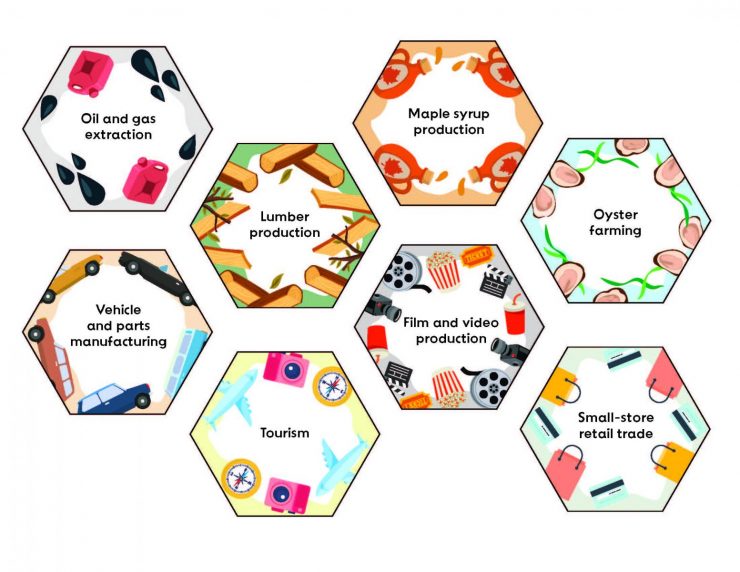
- Canadian economy hexagons — one set of eight per student or small group, on regular paper and cut out (PDF or PPT)
- “Exploring the Canadian economy” industry summary pages — one set per pair of students or small group, on regular paper
- “Connecting industries worksheet” — one per small group, on 11”x 17” paper
For low-printing options, you can:
- have students make their own hexagons and label them
- write the industries on the board and have students sort the concepts using lists in their notebooks
Activity 1: Making connections
Start with a brainstorm and sorting activity to understand the size of different industries in Canada.
Time
40 minutes
1.1 Introduce the industries
Explain to your students that today they’ll be looking at examples of Canadian industries and connecting them to the rest of the national economy.
Provide students with the clue for each of the industries below. Ask them if they can guess each industry and then reveal the answer.
- Southern Ontario assembly plants produce over a million of these machines—and many of their parts—each year.
- Vehicle and parts manufacturing
- Farmers in this industry raise these shellfish on the eastern and western coasts and sell them around the world.
- Oyster farming
- The food featured in this industry is a symbol of Canada and comes in a can or bottle.
- Maple syrup production
- This industry uses Canadian locations as stand-ins for far-off places.
- Film and video production
- The industry that makes this essential construction material has a storied history of trade disputes.
- Lumber production
- If you’re looking for “convenience,” this industry is one small example.
- Small-store retail trade
- This is a Canadian energy juggernaut that is going through a major transition.
- Oil and gas extraction
- Historic landmarks, charming neighbourhoods and incredible museums feature in this industry.
- Tourism
1.2 Introduce the Canadian economy
Explain to your students that the eight industries just discussed are part of the larger Canadian economy but aren’t necessarily the largest or smallest industries. Rather, they show a diversity of sectors, sizes and regions—some of them might surprise you!
These industries are interconnected and together form an economy. In Canada, both regional economies and the national economy grow and shift over time as buyers’ demands change and as industries specialize to get better at what they do.
Hand out a set of the hexagon tiles to each student or group. First, have them sort through the hexagons, thinking about what their region is known for. Ask them to create a pile of key industries that relate most to their own region.
Show the interactive map on the smartboard or screen to illustrate some key regional economies.
Atlantic region:
- Tourism
- Offshore energy
- Fishery and ocean industries
- Natural resource processing
Quebec:
- Electric power
- Movie, TV and radio production
- Aerospace
- Aluminum production
Ontario:
- Telecommunications
- Banking
- Auto manufacturing
- Computer systems design and data services
Saskatchewan and Manitoba:
- Mining
- Transportation
- Oil and gas production and distribution
- Farming
- Energy support services
Alberta:
- Energy support services
- Chemical manufacturing and refining
- Oil and gas production and distribution
British Columbia:
- Mining
- Forestry
- Real estate and construction
- Tourism
- Movie production
Territories:
- Tourism
- Air transport
- Mining
- Hunting and fishing
Ask your students why economies in different places are made up of different industries. What factors do they think influence regional economies?
Some of the key factors that influence the location of different industries are access to:
- a natural resource
- a market for buying and selling
- financing to support the industry—from individuals, businesses and/or governments
- an available labour force
- transportation to move the product or service
Next, explain the following terms:
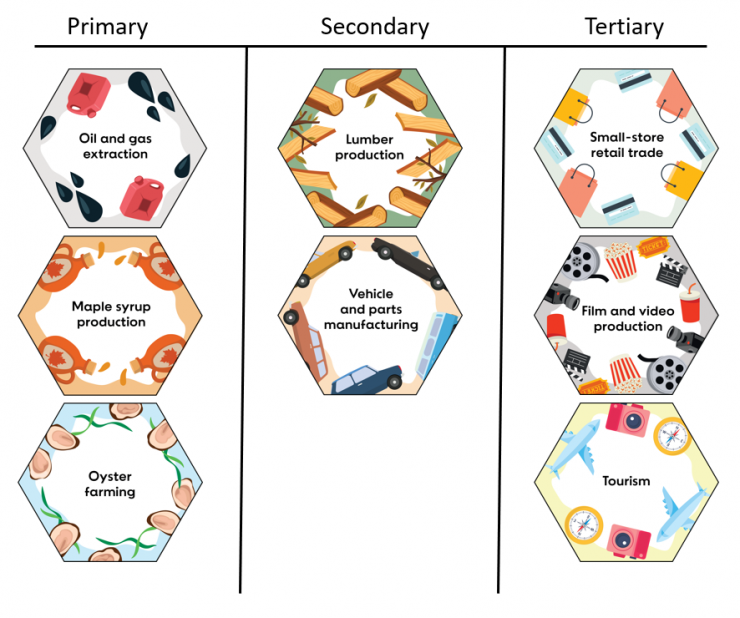
- The primary resource sector includes industries that extract and process natural resources, such as at a coal mine.
- The secondary resource sector includes industries where primary resources are further manufactured or converted into a value-added product—usually a consumer good. An example is glassware made at a glass factory.
- The services (or tertiary) sector includes industries that provide services to people and sell goods from the other sectors. Some examples are a restaurant selling a meal made from imported food, or an author selling their story to a magazine.
Next, ask the students to sort the industries on their hexagons into primary, secondary and services sectors.
Answer: Maple syrup production, oil and gas extraction, and oyster farming are industries in the primary resource sector. Lumber production and vehicle and parts manufacturing are both secondary industries. Service industries listed are small-store retail trade, tourism, and film and video production.
Read students the following excerpt from the article “Canada’s regional economies”:
“Over the past 40 years, all of Canada’s regional economies have experienced an incredible amount of change—from being centred around natural resources and heavy industry to becoming more focused on the services sector. This evolution mirrors the:
- general rise in the education level of the Canadian population
- global shift toward knowledge-intensive work across all sectors of the economy
Then explain these points to students:
The natural resource industry has been a traditional staple of the Canadian economy given our large landmass and resources. In 2021, nearly 13% of our gross domestic product (GDP) came directly from natural resources, which includes two of our major players in the hexagons—energy and forestry. GDP is used to quantify the size of a country's economy, and can be measured by either:
- expenditure, which is the total amount spent on goods and services
- income, which is the total amount of money earned by workers and companies
- industry, which is the total value of what an industry produces minus the value of materials, labour and energy needed for the production process.
Manufacturing and the services sector are also important parts of an advanced economy. Service industries exchange ideas and research, and support economic development every day. These industries also help employment, exports and overall GDP to grow. In 2017, the services sector accounted for just over 70% of Canada’s total GDP.
1.3 Sort the hexagons
Now have students sort the industries by lowest to highest value of their output in the country. This is similar to measuring GDP by industry.
Answer: The largest industries for Canadian GDP are those that produce the highest value of output (in value-added terms). From 2021 data, the order is:
- Oil and gas extraction (roughly $174 billion)
- Small-store retail trade (roughly $41 billion)
- Lumber production (roughly $20 billion)
- Vehicle and parts manufacturing (roughly $16 billion)
- Tourism (roughly $12.8 billion)
- Film and video production (roughly $11.3 billion)
- Maple syrup production (roughly $1.2 billion)
- Oyster farming (roughly $39 million)
Tell students that the most valuable global commodities and services make up the top of the list. The smallest industry featured (oyster farming) would surpass maple syrup production (more than $1 billion) if it included lobster, crab and shrimp—its aquaculture cousins.
Next, ask students to try and rank the industries by highest to lowest employment in Canada. Tell them to think about GDP but also about the types of industry (for example, services versus resource extraction and manufacturing) and the number of people who work in them.
Answer: Between 2019 and 2022, the size of employment is ranked as follows1:
- Small-store retail trade (roughly 1.9 million jobs)
- Tourism (roughly 620,000 jobs)
- Film and video production (240,000 jobs)
- Oil and gas extraction (roughly 170,000 jobs)
- Vehicle and parts manufacturing (roughly 153,000 jobs)
- Lumber production (roughly 32,000 jobs)
- Maple syrup production (roughly 15,000 jobs)
- Oyster farming (less than 4,000 jobs)
Ask your students if they noticed anything different among the industries when measuring the top GDP/value by output and the top employment?
If time allows, ask students to think about the different jobs required to make a good or deliver a service. These can be thought of in terms of direct and indirect jobs. For example, a retail store employs five workers who deal with customers. These are the direct jobs. But these workers rely on others—that is indirect jobs—to do their jobs, such as factory workers who manufacture the goods sold and drivers who transport goods to the store.
For a longer discussion, ask your students to create their own sorting question for their peers, such as which industries they think have grown or shrunk over time, or which are most at risk from climate change. Once their peers have answered the question, have the respondents share their logic. How would they be able to prove if they were correct?
Activity 2: Deep dive into the industries
Select one industry to read more about in small groups and identify economic concepts from each of the industries.
Time
40 minutes
Take a deeper dive into each of the industries featured on the hexagons by reading a summary page and answering some discussion questions.
2.1 Introduce the industry summaries
Put your students in pairs or rearrange them into new small groups. Hand out one of the eight Exploring the Canadian economy industry summaries for each group or pair. Ask them to read over the summary, then answer the follow-up questions below, to check their comprehension and encourage discussion. (Depending on the grade level and assessment intent, they can either write notes or answer verbally).
- Why do you think this industry is important to Canada? Why do you think it’s happening here?
- How would changes in this industry, like a drop in the amount of goods produced, affect other industries? How might consumer habits influence your industry?
- What might be some future risks and opportunities for this industry (e.g., technology, automation, climate change, change in demand)?
- If you were an owner of a business in this industry, how might inflation (the increased cost of goods) affect you? How could you limit the impacts of inflation on your industry?
Allow some time for conversation in their pairs or groups before moving on to the next activity.
The Bank regularly surveys industries big and small to get a sense of their views on the economy and whether businesses expect growth in their sectors. These data are assessed along with GDP (gross domestic product), consumer expectations and the consumer price index, which measures inflation. All of the data helps the Bank make better decisions on inflation and the policy interest rate.
2.2 Connect industries to economic concepts
Next, use the Exploring the Canadian economy industry summaries to provide some new economic concepts for your students.
Explain that Canadian industries are often built from demand or an advantage. When we can produce a particular good or deliver a service more efficiently or profitably than we can for other goods or services, we have a comparative advantage in relation to other countries for specializing in that good or service.
The same happens with regional specialization. This might come from having a certain type of resource that is unique to that area, or a special skillset of the region’s workforce, or existing space or machinery.
Ask the students to raise their hands if, compared with the other industries, they think their industry is the best example of comparative advantage for Canada.
Answer: Canada has a comparative advantage in producing many natural resources, given its landmass and rich endowment of natural resources. Lumber, oil and gas, and maple syrup are clear examples: few other places can produce the quantities that Canada can. In fact, compared with most of the world, Canada has an absolute advantage for oil and gas and maple syrup—it can produce more of these goods with the same amount of intermediate inputs/materials, labour, energy and effort.
Use maple syrup to demonstrate absolute advantage. Canada produces most of the world’s supply. There is an advantage in having the trees already growing in a region of the country and people who have specialized over centuries in tapping the trees. While other countries could plant maple trees and produce their own sap if they have the same climate and soil conditions, it’s probably easier to receive it as an export from Canada and focus on other industries they excel in.
Continue this line of questioning and identification with the following concepts. After reading each of the definitions, ask the students to raise their hands if they think their industry is the best example of that concept, compared with the other industries. Students should justify their answers.
Economies of scale: The more units a business produces, the cost per unit declines and it becomes cheaper to produce each unit. A large business can buy and transport materials more cheaply in bulk and spread costs such as workers’ wages and advertising across a greater number of units sold.
Answer:
- Canada’s oil and gas industry needs to sell a high volume of its products to cover the large overhead costs required to extract the oil and gas, such as salaries, utilities, insurance, etc.
- The efficiencies in vehicle and parts manufacturing benefit from large-scale assembly lines.
- Lumber production requires a good deal of equipment.
Foreign exchange rates: The cost of international trade means importing countries need to pay for goods (or labour, in the case of exporting services) to make them in the currency of the exporting country. If the value of a country's currency declines, then its exports become cheaper for other countries to import, which increases demand for the exporting country's goods and services. If the value of a country's currency goes up, then its exports become more expensive for other countries to import. But it becomes cheaper for that country to buy goods and services, which increases demand for imports.
Answer: Canada is a net exporting country, meaning we export more than we import. So foreign exchange rates are very important to Canadian businesses, especially for the currency of our largest trading partner, the US dollar. Canadian industry benefits when the Canadian-US exchange rate weakens because it makes Canadian exports cheaper and more appealing for other countries. For example:
- Oil and gas are usually priced in US dollars as a global commodity (or primary-sector good), so when the US dollar is strong, Canadian exporters receive more in Canadian-dollar terms for every unit sold, making them more profitable.
- A weak Canadian dollar makes it attractive for American film companies to produce films in Canada because local labour and materials costs are cheaper to pay for in Canadian dollars.
Foreign exchange rates strongly affect the tourism sector: a weaker Canadian dollar increases international visitors and domestic tourism, while a stronger dollar deters international tourists and increases Canadian tourism abroad.
Labour cost advantages: When labour is cheaper in another country than it is in Canada, a Canadian company can save money by providing a service or producing a good elsewhere.
Answer: Film and video production—a service industry—benefits from Canadian labour, which is cheaper than American labour and therefore an advantage to American companies.
Government interventions: The government is a common source of market distortions such as taxes, subsidies and tariffs. When a government offers advantages or disadvantages to industries, this can affect the price, demand for or availability of goods and services.
Answer: The government provides subsidies to encourage growth in areas it is trying to promote.
- Often, governments give tax breaks or subsidies to small businesses, such as those in the small-store retail trade.
- Many provincial governments offer tax credits (that reduce the amount of taxes they pay) to support film and video production.
- Companies that build vehicles or make auto parts have traditionally received tax breaks (a lower tax level) or other incentives to build or expand manufacturing plants in Canada.
- Governments may offer specific grants or business licenses to start up Indigenous oyster farming.
Supply chains: Industries use a series of processes to take a product from creation through to sale and use. Businesses may even move the product between different factories for different steps in producing it. The more steps in a supply chain, the more risk of delays or production. But these risks may be outweighed by increased efficiencies through cutting labour and production costs.
Answer:
- Vehicles are manufactured using a complex, networked supply chain of parts moving between different factories and countries. This saves money and time and adds value to the manufacturing and assembly.
- Oil and gas extraction requires a supply chain to move the raw products into refineries, which are often located outside of the country. Eventually, the products return as fuels.
- Retail trade also relies on supply chains for the goods that stores sell.
Businesses in the primary and secondary resource sectors produce and convert raw goods such as metals, produce plastics, assemble electronics and ship the final products. Any breaks or delays in these systems can cause delays through the entire supply chain.
Activity 3: Jigsaw groups to connect industries
Students will look at large industries beyond those in their hexagon examples and connect these industries together in a systems-based approach.
Time
15 minutes
3.1 Label the broader industry
In this next group activity, your students will make connections between each industry.
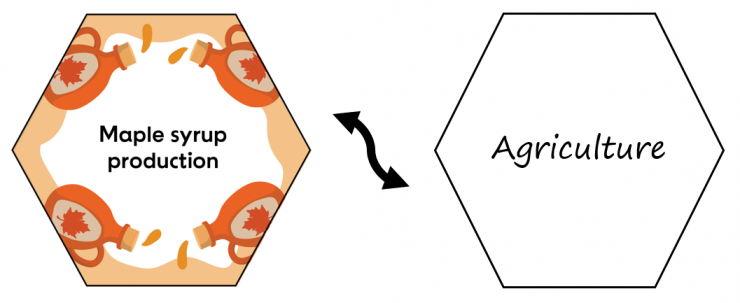
First, ask students to look again at the industries on their hexagons. Each industry is part of a larger one. Students should flip over their hexagons to label the back with the corresponding, larger industry (these are found on the summary sheets). Inform them that two of the hexagon industries—oil and gas extraction and vehicle and parts manufacturing—are already broad umbrella categories, so students should leave them as they are.
Answers:
- Maple syrup production <-> Agriculture
- Lumber production <-> Forestry
- Oyster farming <-> Aquaculture
- Small-store retail trade <-> Retail trade
- Tourism <-> Accommodations and food services
- Film and video production <-> Cultural industry
- Oil and gas extraction (stays the same)
- Vehicle and parts manufacturing (stays the same)
3.2 Find common threads between industries
Next, have students form jigsaw groups: each group should contain students who explored different industries in the prior activity.
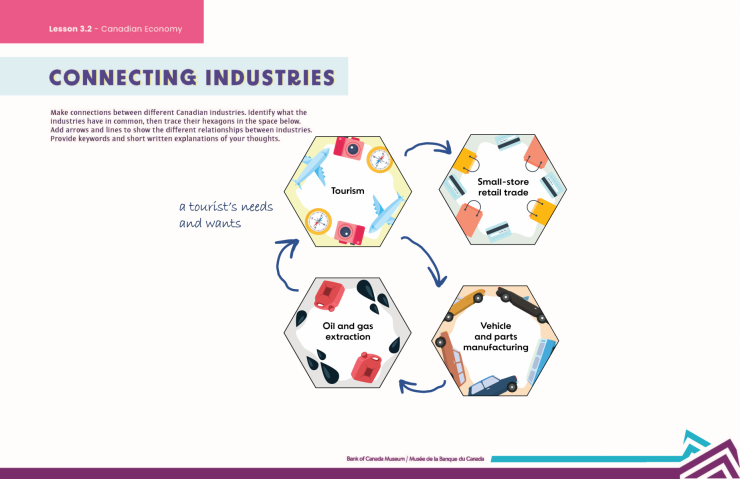
Hand out one copy of the worksheet “Connecting industries worksheet” to each group. Review the worksheet instructions together to support the activity.
Each group should arrange the hexagons in ways that show how industries connect to each other. What do some of the industries have in common? Can students make at least three-way connections between industries? They should then trace the hexagons and label the common thread on the worksheet. For example, a common thread between agriculture and oil and gas extraction might be the rise of biofuels influencing demand for each of their respective products.
To add a competitive edge, ask your students to try and combine them all together.
The worksheet has extra spots for students to add more industries. They can creatively guess which ones they’d like to add, or you can provide some extra examples on the board, such as real estate, construction, mining, banking, healthcare and education. For an additional challenge, give students one good or service to connect to all of the industries (such as a bag of chips or a telemarketer).
Activity 4: Your place in the Canadian economy quiz
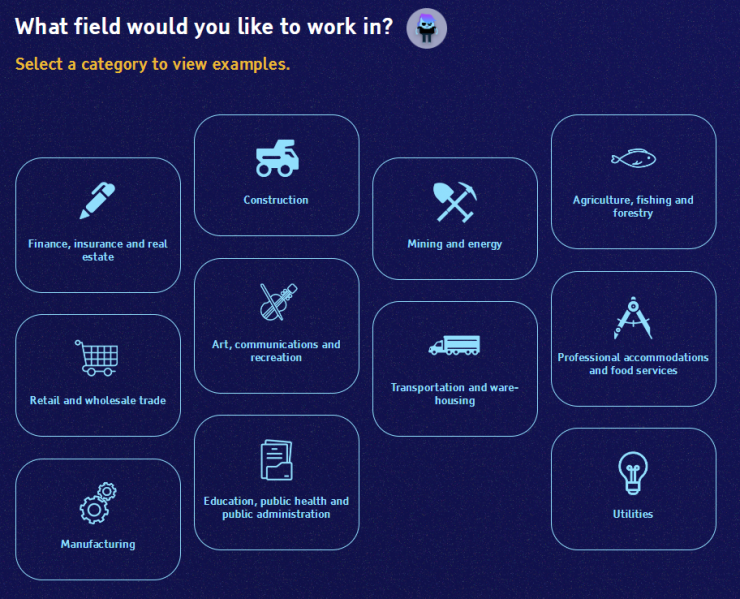
Take an interactive quiz that uses a data visualization tool to further explore how the industries are connected to jobs and regional economies.
Time
10 minutes
Help your students navigate to the quiz on an internet-connected device. Ask them to take the quiz in small groups or individually.
The quiz can help activate prior knowledge of different employment fields and the number of jobs in each of them. Students should pause at the fourth question on field of work to compare employment data across provincial, territorial and national data.
For best results, have students take the quiz once with their personal answers, and then do it again to analyze regional trends.
After students have completed the quiz, ask them the following questions:
- What did you notice about the size of the industry compared with percentage of Canadians who work in it?
- How can you connect the industries you looked at earlier to the job fields featured in the quiz? (For example, the lumber production industry would require forestry professionals to assess where and how much to cut down and to regrow, along with transportation and sales workers.)
Regional employment in different industries can grow and shrink. While a particular sector might have a major impact on one area of the country, the Bank of Canada’s monetary policy helps to stabilize overall demand in the economy and keep the economy on a long-term path to stable growth.
Conclusion
Time
5 minutes
End the class by asking your students to stand up if they agree or disagree with the following statements. Then take a moment to ask a few students to share their opinion.
- Technology will bring more opportunities in most of the industries we reviewed today.
- Climate change will bring challenges and opportunities to the industries discussed today.
- Canada should move more towards a service economy and away from primary-sector processing of natural resources.
Finally, have your students discuss what they learned about each of the industries and the Canadian economy in general. Ask the following questions:
- What did you realize or what surprised you about the conversations today?
- After reviewing the industries and the quiz, has your perspective changed on the types of jobs you are interested in someday?
Key takeaways
- Canada’s national and regional economies include a variety of sectors that evolve with national and international demand.
- Larger sectors of the economy are interconnected and support employment and growth.
- Each industry has its challenges and opportunities for the future.
Extensions
- For an additional overview of industries and the Canadian economy, check out “Canada’s Regional Economies” from the Bank’s Economy, Plain and Simple series.
- Conduct more research into one of the industries featured in this lesson or another industry within your region. Statistics Canada data using the North American Industry Classification System are a great place to start.
- Look at Canadian commodities traded since Confederation using the trade section of our Canada and the global economy data visualization tool. Assign each student a different trade good to explore its changing demand and production.
- Pick one of the economic concepts explored in the lesson (incentives, subsidies, economies of scale, supply chains, labour cost advantages, and comparative and absolute advantages) and have students do a research project on it, looking at other applicable industries.
- 1. These data are the most recent available at the time of writing and come from the following sources: Statistics Canada; Innovation, Science and Economic Development Canada; Fisheries and Oceans Canada; Natural Resources Canada; Canadian Vehicle Manufacturers’ Association; Motion Picture Association—Canada; and Producteurs et productrices acéricoles du Québec.[←]
We want to hear from you
Comment or suggestion? Fill out this form.
Questions? Send us an email.
